
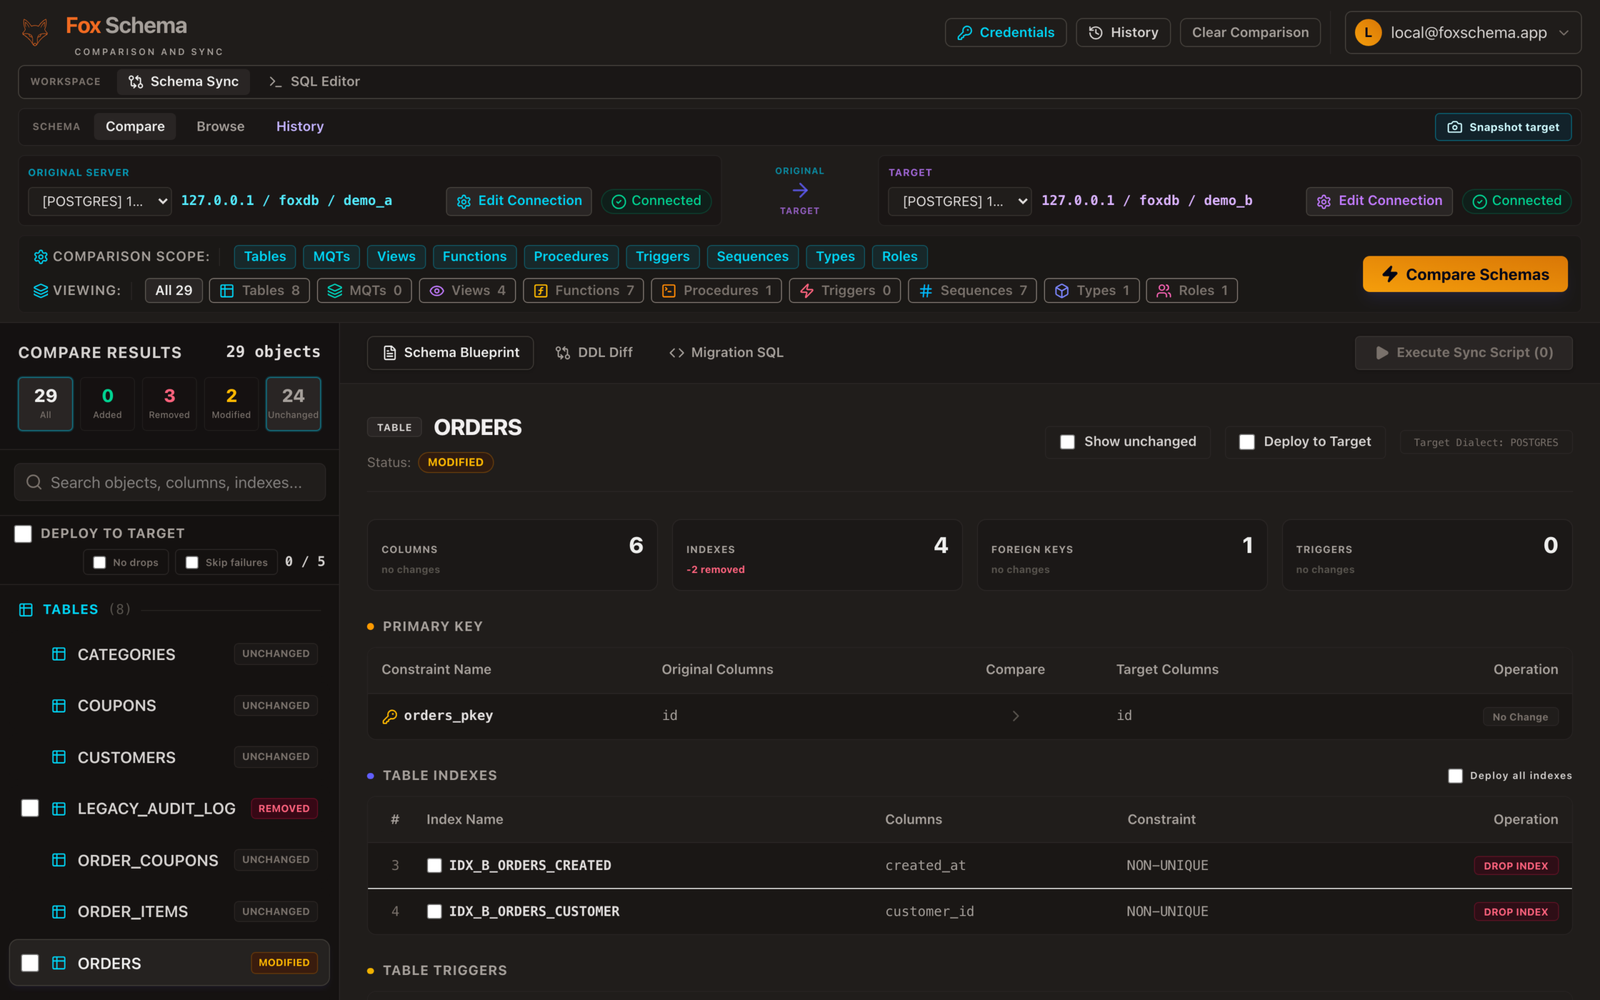
Every index in your schema costs something on every write, whether or not it ever speeds up a read. Learning how to find unused database indexes — with real numbers from the database itself, not guesswork — is what separates a useful cleanup from an outage caused by dropping the wrong one.
Why "it exists" isn't the same as "it helps"
A cost-based optimizer picks the cheapest plan it can find, and an index that exists is not guaranteed to be part of that plan. A low-selectivity index — one on a column where most rows share the same value — often loses to a plain table scan. Meanwhile, every INSERT, UPDATE, and DELETE still has to maintain that index regardless of whether any query ever reads it. The question worth asking isn't how many indexes a table has, it's which ones are actually earning their write cost.
Rule one: never drop on a zero-usage counter alone
A usage counter of zero is a lead, not a verdict. It can mean the index is genuinely dead weight — or that it backs a PRIMARY KEY or UNIQUE constraint, supports a quarterly report that hasn't run yet, or that the counter itself was reset by a recent restart. Always observe usage over a representative window (a week at minimum, a full billing or reporting cycle if you have one) before touching anything, and check constraint dependencies first.
Where to look, by dialect
Every major engine exposes this differently:
- PostgreSQL —
SELECT * FROM pg_stat_user_indexes WHERE idx_scan = 0;join againstpg_stat_user_tablesto compare scan counts with write volume on the same table. - MySQL / MariaDB — query
performance_schema.table_io_waits_summary_by_index_usageand look forCOUNT_READ = 0alongside a highCOUNT_WRITE. - SQL Server —
sys.dm_db_index_usage_statsgives seeks, scans, lookups, and updates per index, but the counters reset on every engine restart, so a zero doesn't mean "never used." - Oracle —
DBA_INDEX_USAGEgives cumulativeTOTAL_ACCESS_COUNTandLAST_USED; for a tighter window,ALTER INDEX ... MONITORING USAGEtracks a specific index over a chosen period. - IBM Db2 —
SYSCAT.INDEXES.LASTUSEDfor long-term history, andMON_GET_INDEXfor scan counts since the current database activation. - SQLite — no persistent usage stats; run
EXPLAIN QUERY PLANagainst your real queries and look forSEARCH ... USING INDEXversusSCAN.
The pattern worth chasing
Across every dialect, the same shape stands out: an index with near-zero reads and a high write count relative to its table's insert/update/delete volume. That combination means the database is paying maintenance cost on every write with no measurable read benefit — the strongest cleanup candidate you'll find. Composite indexes deserve the same scrutiny: three overlapping single-column indexes are often worse than one well-ordered composite index built for the actual query pattern.
A safe audit workflow
Before removing anything: confirm the index doesn't back a constraint, observe usage over a full representative period, check for overlapping indexes on the same leading columns, and test the removal against a production-sized copy before touching the real table. If you're not sure what an index's absence will do to a query plan, run EXPLAIN against the real query first rather than relying on the usage counter alone.
Index cleanup is really a subset of schema review more broadly — the same discipline that applies when you're comparing two schemas and generating migration SQL, or wiring that comparison into CI so drift gets caught automatically. Self-host FoxSchema in Docker to review index and constraint changes across ten dialects before they ship.
