
If you already think in Excel formulas, learning SQL with your own Excel data is a faster path than working through generic tutorial tables you don't care about. This walks through importing a spreadsheet, running real queries against it, and exporting the results back out — using FoxSchema's SQL Editor the whole way.
Step 1 — get your sheet into CSV
FoxSchema's Query files utility imports CSV/TSV, JSON, and fixed-width text directly — it doesn't read .xlsx workbooks natively yet. The practical workaround costs one click: in Excel or Google Sheets, use File → Save As / Download → CSV for the sheet you want to query. If your workbook has several sheets you care about, export each one as its own CSV — you'll import them as separate tables and can join them in SQL, which is the whole point of doing this in a database instead of VLOOKUP.
A typical export might look like this orders.csv:
order_id,customer,product,quantity,price,order_date
1001,Acme Co,Widget,4,12.50,2026-01-05
1002,Acme Co,Gadget,1,89.00,2026-01-06
1003,Beta LLC,Widget,10,12.50,2026-01-09
1004,Beta LLC,Sprocket,2,45.00,2026-01-12
Step 2 — import it
Open the SQL Editor, then Utilities → Query files. Pick your CSV, confirm the delimiter (comma is the default), and leave the destination on New temp SQLite workspace — it's the fastest way to start and needs no server setup. FoxSchema creates a Files: … connection and a table matching your columns, checked automatically as a Destination so you can query it immediately.
Step 3 — write your first queries
Against the orders table above, the SQL equivalents of common spreadsheet tasks:
-- SUM(quantity*price), grouped — like a pivot table
SELECT product, SUM(quantity * price) AS revenue
FROM orders
GROUP BY product
ORDER BY revenue DESC;

-- filter, like AutoFilter
SELECT * FROM orders
WHERE order_date >= '2026-01-06'
ORDER BY order_date;

-- top N, like sorting + trimming rows
SELECT * FROM orders
ORDER BY quantity DESC
LIMIT 3;
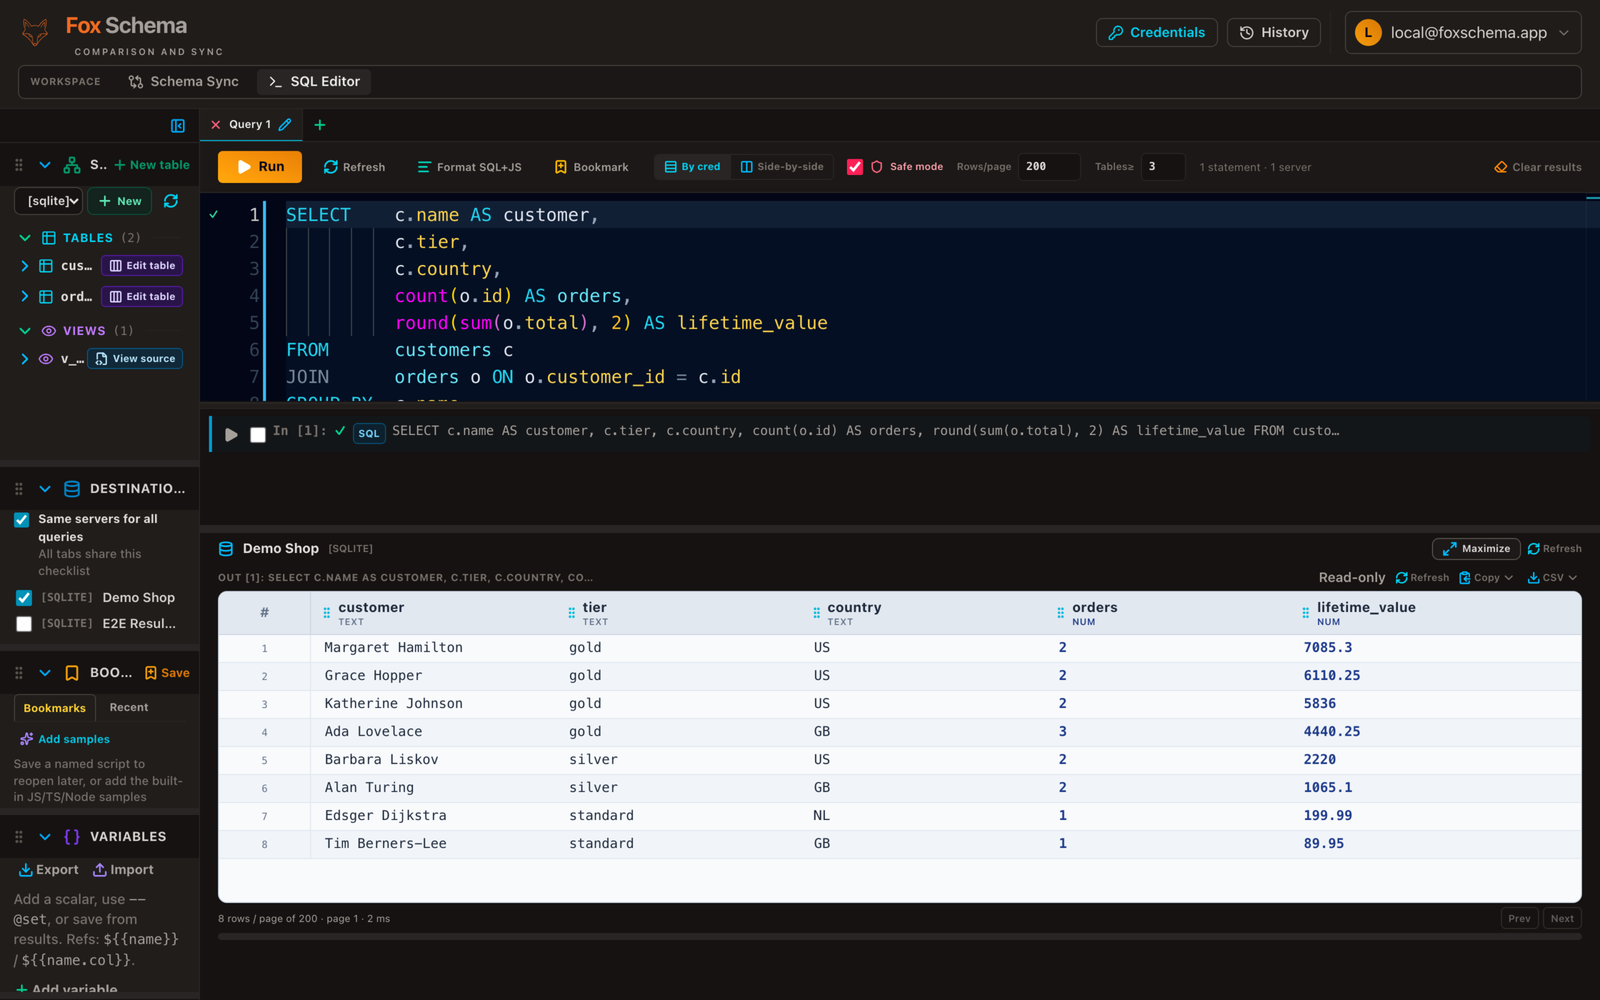
The schema explorer on the left lists your imported table and its columns — click a column name to insert it at the cursor instead of retyping it, and autocomplete will suggest it as you type.
Step 4 — bring in a second sheet and join them
Export a related sheet as its own CSV, e.g. customers.csv:
customer,region
Acme Co,West
Beta LLC,East
Import it with Add table to existing Files workspace so it lands as a second table alongside orders in the same temp database. Now a join works exactly like it would against a real database:
SELECT c.region, SUM(o.quantity * o.price) AS revenue
FROM orders o
JOIN customers c ON c.customer = o.customer
GROUP BY c.region
ORDER BY revenue DESC;
This is the exercise that VLOOKUP and pivot tables approximate but never quite make explicit: matching rows across two tables on a shared key, then aggregating the result.
Step 5 — export the result back to a spreadsheet
Every result grid has an Export CSV button in its toolbar. Run your query, click it, and the query result downloads as a CSV you can reopen directly in Excel or Google Sheets — useful for sharing a query's output with someone who isn't going to open the SQL Editor themselves, or for feeding the result into a chart back in your spreadsheet tool.
Where to go from here
Once a query against your own data clicks, the natural next steps are variables (reuse a value across several queries with ${{name}}), multi-destination Run (compare the same query against several imported files or real connections at once), and eventually pointing the same SQL Editor at a real database instead of a CSV. See the Query files guide for the full import reference, or install FoxSchema and try this against your own spreadsheet.
